Sawtooth Interpretive and Historical Association
The Stanley
Weather Record
ACIS 108676 2 · NOAA/GHCN USC00108676
110-year station daily record, 1916-present.
High76normal 59
Low20normal 20
Precip0-0.05 in vs normal
The Station
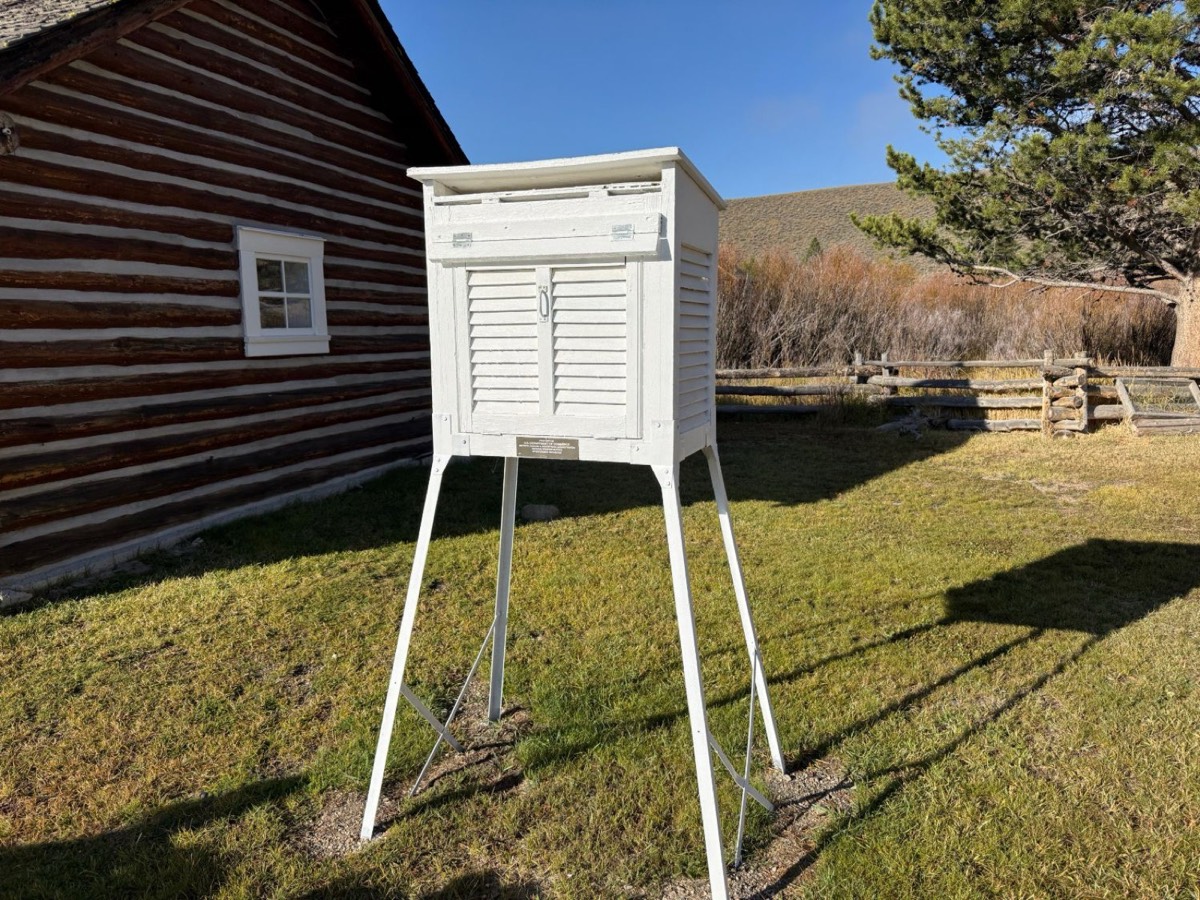
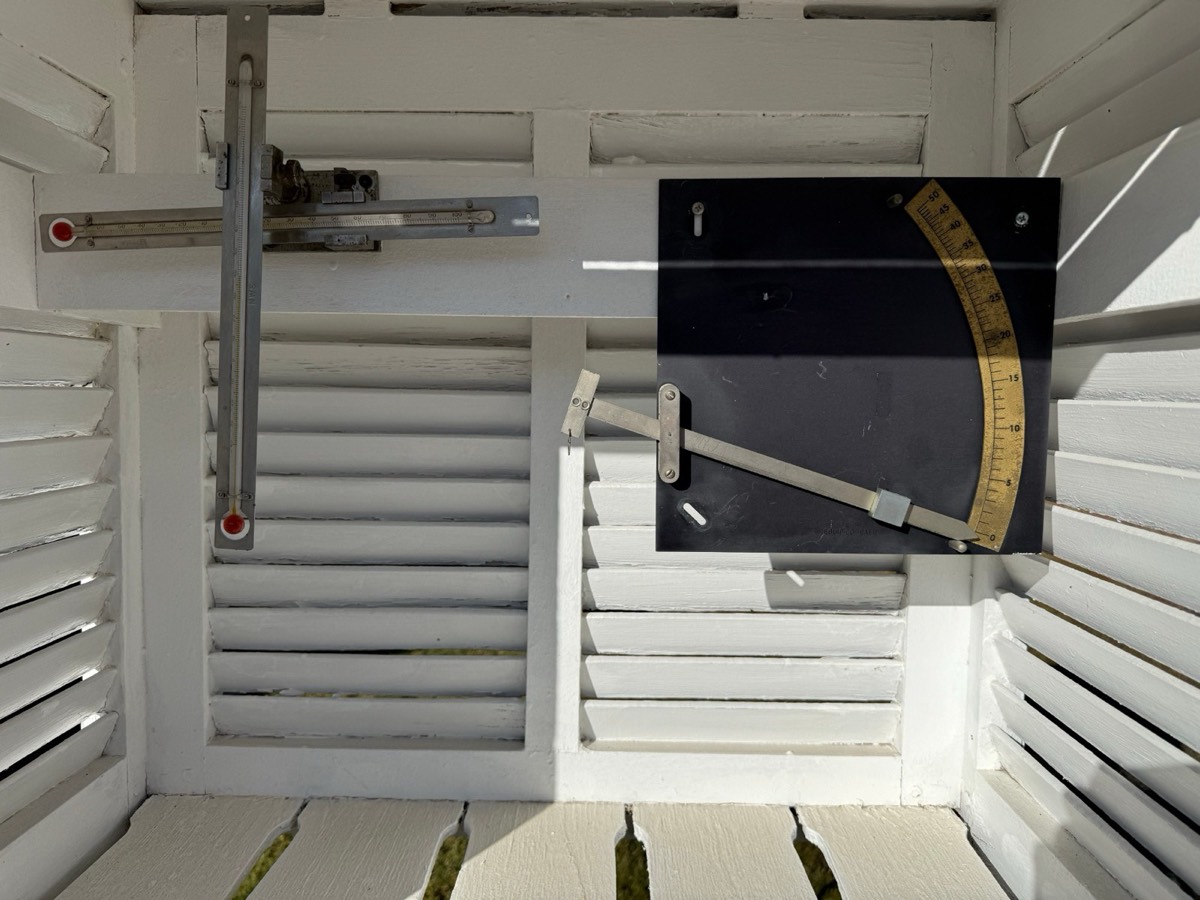
This white louvered box is a Stevenson screen, designed in 1864 by Thomas Stevenson, a Scottish lighthouse engineer and the father of writer Robert Louis Stevenson. The slats let air move through while keeping out sun and snow, so the thermometers read the true air temperature. In the U.S. version, called a cotton region shelter, the thermometers sit about five feet off the ground. Because that height is the same at stations across the country, their readings can be compared.
When Stanley’s record began in 1916, a shelter like this stood at nearly this exact spot. This one isn’t the original. It is a NOAA-restored shelter, reinstalled here at the Stanley Museum in the spring of 2026. Today’s daily observations come from a Stanley resident about a quarter mile away.
This Day in History
October 10 across the Stanley record.
| Record High | 80 deg F1996 |
| Record Low | 8 deg F1985 |
| Wettest | 0.34 in2018 |
| Snowiest | 1 in1920 |
| Normal High / Low | 59 / 20 deg F |
2026See how the weather on this day changed over the years by using the slider.
October 10, 202676 / 20 deg Favg 48 - precip 0 in - snow 0 in
All-Time Records
How Cold Is Stanley?
We compared Stanley with 99 ACIS temperature stations in 18 states, focusing on nearby Idaho towns and places known for cold conditions, including Fraser and International Falls. In this 1991-2020 comparison, Stanley ranks #11 for annual average temperature and #2 for July-August freezing nights. Crested Butte and Embarrass are colder across the year, but summer freezing is far less common there.
Annual average and summer freezing1991-2020
Explore the full cold-place comparison
Your turnHow does your home compare?Put Stanley beside your hometown.The Year in Temperature
The inside edge of the colored ring is the normal low for each day. The outside edge is the normal high, and the dotted circle marks freezing.
Full normal yearnormal 52.6 / 16.5 deg F / 18.2 in precip
Annual Temperature Map
Each square is one calendar year. Blue years are cooler than the 1991-2020 station average, red years are warmer, and gray years are partial or missing. The current year is left out until it is complete.
coolernear averagewarmerpartial / missing
The largest missing span runs from September 1, 1928 to June 30, 1963. After 1963, a few gray years have some observations, but not enough daily temperature records for an annual comparison.
More Ways to Look
Snow by Year
2025: 93.3 inTotal snowfall recorded in each calendar year. Years with too few daily records are shown lightly.
Precipitation by Year
2025: 20.9 inTotal rain and melted snow recorded each year. Only years with enough daily records are emphasized.
Cold Nights
2025: 50 nightsNights when the recorded low temperature reached 0 deg F or colder.
Deep Dives
Focused looks at interesting climate patterns visible in the Stanley station record.